Session 6· ·exchange rates
Real Exchange Rates & Productivity
Tradables vs non-tradables, PPP, Balassa-Samuelson, and why richer countries look expensive to visitors.
- #exchange-rates
- #productivity
- #balassa-samuelson
- #ppp
- #tradables
Session 6 · Real Exchange Rates & Productivity
LockedSign in with your ISB email to watch this recording.
Medium-term macro begins: tradables against non-tradables, why the same dentist earns differently in Hyderabad and New York, Balassa-Samuelson without the hand-waving — and the one exchange-rate number he insists you track. It is the REER, not the headline rupee, and the RBI publishes it every month for free.
Medium-Term Macroeconomics Introduction
This session marks the transition from short-term to medium-term framework analysis. The fundamental shift involves understanding how inflation expectations become a critical variable in macroeconomic behavior.
The big difference in the medium term is inflation expectation.
Tradable vs Non-Tradable Sectors
The Tradable Sector
• Definition: Anything with global competition
• Examples: IT services, pharmaceuticals, consulting
• Income driver: Worker efficiency and productivity
“The only way you can earn above competitive wage is by being efficient.”
The Non-Tradable Sector
• Definition: Services with local markets, no global competition
• Examples: Haircut, dentistry, teaching, medicine, driving, yoga, entertainment
• Workforce: Two-thirds of population works here, even in developed countries
• Income driver: Customer’s wealth, NOT worker’s efficiency
Dentist Paradox
Indian dentists are younger, better trained, and equipped with superior technology. Yet they earn approximately 1/10th of what US dentists earn. Why? Because their customers are significantly poorer. In non-tradable sectors, compensation is fundamentally limited by local purchasing power, not by worker quality or productivity.
Real Exchange Rate Appreciation & India’s Crisis
The critical question at the heart of India’s situation:
The problem is not whether the rupee is 90 or 200. Problem is: Are we depreciating more than inflation differential?
Two Scenarios of Currency Depreciation
Scenario 1: Market is Wrong (Temporary)
• Currency depreciates temporarily due to market misalignment
• Will self-correct - no structural worry
Scenario 2: Declining Productivity (Structural Problem)
• Depreciation reflects actual decline in tradable sector productivity
• This is a PERMANENT problem requiring structural reform
REER Index: The Critical Metric
The Real Effective Exchange Rate (REER) is constructed using a basket of 40 currencies that India actively trades with. This provides a comprehensive measure of real exchange rate movements.
Interpretation:
• Base year 2016 = 100 (reference point)
• REER > 100: Real appreciation (currency hasn’t depreciated enough relative to inflation differential)
• REER < 100: Real depreciation (currency depreciating more than inflation differential)
• If exchange moves exactly with inflation differential, REER stays at 100
India’s REER Historical Trajectory
| Period | REER Level |
|---|---|
| 2016 (Base Year) | 100.00 |
| 2016-2020 | 106-107 (Real appreciation) |
| March 2024 | Still 106-107 |
| October 2024 | 94-97 (Sharp drop begins) |
| Late 2024 (Est.) | 90-92 (Very sharp drop) |
PPP & Samuelson-Balassa Theorem
Purchasing Power Parity (PPP) exchange rates differ from real exchange rates because non-tradable sector wages are substantially lower in poorer countries. This seemingly paradoxical relationship reveals something critical about economic development.
PPP income being higher actually shows that one is incompetent in the tradable sector.
Higher PPP figures often reflect lower tradable sector productivity. Richer countries have higher real wages even in non-tradable sectors because their tradable sectors are so productive that they can support higher overall wage levels.
Nominal vs Real Depreciation
“People saying the rupee reaches all-time low - it SHOULD reach all-time low every day vs dollar.”
Why Nominal Depreciation is Expected
Historically, India’s inflation rate has been higher than the United States. it is structural. When one country has persistently higher inflation, its currency depreciates relative to low-inflation countries.
Example:
• India inflation: 6%, US inflation: 4% (inflation differential: 2%)
• Expected rupee depreciation: 2% (to maintain purchasing power parity)
• If rupee depreciates MORE than 2%: Real depreciation → exports become cheaper → competitive gain
• If rupee depreciates LESS than 2%: Real appreciation → exports become more expensive → competitive loss
Current Situation
The inflation differential between India and the US has narrowed to near zero. Yet the rupee is depreciating sharply. This means the depreciation is almost entirely REAL, not merely the expected nominal adjustment for inflation differential.
Sharp real depreciation with minimal inflation differential = something fundamental is changing in India’s competitive position.
RBI Data Deep Dive
The Reserve Bank of India publishes official data on both nominal and real effective exchange rates. This data provides empirical grounding for understanding India’s exchange rate trajectory.
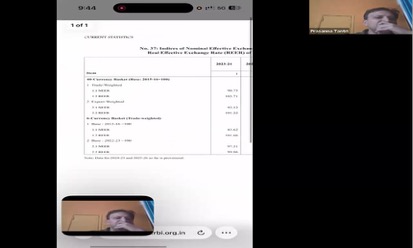
RBI Official Metrics
| Metric | 2023-24 | October 2024 |
|---|---|---|
| NEER | 90.75 | ~88-89 |
| REER | 103.71 | ~97 |
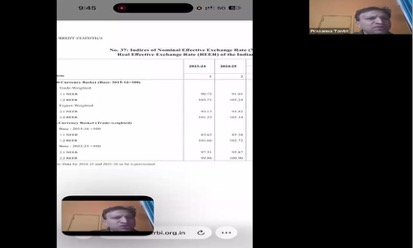
Interpretation
• Nominal depreciation from 90.75 to 88-89: modest, reflects gradual currency adjustment
• Real depreciation from 103.71 to ~97: significant 6+ point drop in just 6-7 months
• Currently estimated at 92-94: not yet fully captured in official data
• This rapid REAL depreciation suggests structural changes in competitiveness
“If it is a fundamental issue, RBI will end up fighting a losing battle.”
The Big Question
Beneath all the technical analysis lies a fundamental question about India’s economic trajectory and future prosperity.
There was consensus that we’ll emerge as a very big economy, the Viksit Bharat economy. But will we reach $20-30-40K per capita? Or plateau at $5-7K?
Divergence of Expectations
Domestic Investors:
• Extremely bullish - “going to the moon”
Foreign Investors:
• Systematically pulling out
“I have no idea who is right - this is very unusual.”
Performance Analysis
Interestingly, FIIs who pulled out weren’t wrong in absolute rupee terms - they actually outperformed by being elsewhere. This suggests that even if rupee has appreciated, other markets provided better returns. This is a nuanced point about opportunity cost and relative performance.
Information Advantage Framework
The best economic indicator is observation accumulation AKA Smell Test
The Case Study: Asian Paints
The professor shared a personal experience visiting a paint dealer. This dealer revealed critical information about competitive threats and market shifts that never appeared in published financial reports. Months later, Asian Paints stock underperformed - validating the ground-truth information gathered through informal observation.
The Framework for Information Advantage
• Visit factory floors
• Sit in employee canteens and observe conversations
• Talk to suppliers about their margins and strategic challenges
• Build a systematic collection process for informal information
“Half day Saturday, devote to collecting information from non-standard sources.”
• Published financial data is available to everyone - zero competitive advantage
• Ground-level observations reveal information gaps that markets haven’t yet priced
• This is particularly valuable for identifying risks and structural shifts early
Takeaways
1. The Critical Exchange Rate Question
The rupee’s absolute level (90 or 200) matters far less than whether it is depreciating more than the inflation differential. Real exchange rate movements, not nominal ones, determine trade competitiveness and economic health.
2. Sectoral Wage Divergence
Tradable sector wages are determined by global productivity and efficiency. Non-tradable sector wages are constrained by customer wealth. This explains why Indian dentists earn 1/10th of US dentists despite superior skills.
3. REER as the Key Metric
India’s REER fell from 106-107 (March 2024) to approximately 92-94 (late 2024). This sharp real depreciation, occurring when inflation differentials are minimal, suggests structural changes in India’s tradable sector competitiveness.
4. Fundamental vs Temporary Movements
If the rupee’s weakness reflects fundamental productivity declines in tradable sectors, no amount of central bank intervention can reverse it. RBI cannot fight structural economic forces indefinitely.
5. The PPP Paradox
Higher PPP-adjusted income in developing countries doesn’t reflect strength - it reveals tradable sector weakness. Developed economies support higher non-tradable sector wages because their tradable sectors are so productive.
6. The Expectation Divergence
Domestic and foreign investors have sharply divergent views on India’s future. This unusual situation - where even FIIs’ outperformance elsewhere doesn’t resolve the disagreement - suggests fundamental uncertainty about India’s growth trajectory and per capita income potential.
7. Information Advantage Through Observation
Published data provides no competitive advantage - everyone has access. Ground-level observation of factory floors, supplier conversations, and informal market dynamics reveals information gaps that markets haven’t priced. This requires systematic effort and deliberate time allocation.
8. Medium-Term Framework Fundamentals
The shift from short-term to medium-term analysis requires understanding inflation expectations and how they anchor wage and price-setting behavior. Exchange rates, competitiveness, and long-term growth trajectories all hinge on expectations about future inflation.
What You Can Now Do
Stop reacting to ₹/$ headlines; open the RBI bulletin’s REER table instead. A falling rupee with a stable REER is arithmetic, not crisis — that distinction is the whole session, and it is also the argument of his own Mint column on the rupee. And keep the Asian Paints case in mind: the information advantage came from observing the mechanism, not from a terminal.
Continue to Session 7 — Exchange Rates, Inflation & Interest Rate Parity.