Session 4· ·is mp
IS-MP Framework & Modern Monetary Policy
Integrating interest-rate policy into the short-run model — and what it means for India's policy space.
- #is-mp
- #monetary-policy
- #rbi
- #central-banking
- #india
Session 4 · IS-MP Framework & Modern Monetary Policy
LockedSign in with your ISB email to watch this recording.
This is the session where the course becomes a usable machine: the IS curve from the goods market, the MP curve from the RBI’s reaction function, and every stimulus debate reduced to one question — does the central bank accommodate, or not? India’s fiscal trilemma gets named here too, and it does not flatter anyone.
Review of Previous Material

The Keynesian Short-Run Model
The foundational identity from our previous session is:
Y = C₀ + C₁(Y−T) + I + G
Key assumptions underlying this model:
-
Prices are rigid in the short run
-
Supply is effectively unlimited at the prevailing price level
-
Investment (I) and government spending (G) are exogenous
-
Output adjusts to clear the goods market
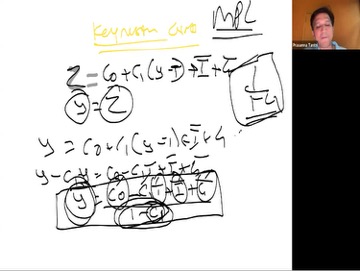
Keynesian Cross from October 19 Session
The Multiplier Effect Revisited
In the short run with rigid prices, the multiplier mechanism is the central transmission channel: Demand Shock → Expenditure → Income → Further Consumption → Further Income
The multiplier formula:
Multiplier = 1 / (1 − C₁)
Where C₁ is the marginal propensity to consume. A higher MPC leads to a larger multiplier effect.
Professor Tantri emphasizes: Most Indian macroeconomic discourse incorrectly applies the multiplier model as a long-term framework. This model is fundamentally SHORT-TERM and is rendered invalid once prices become flexible.
The IS-MP Framework: Integrating Interest Rates
Investment as a Function of Interest Rates
Major Innovation: Relaxing the constant investment assumption
The previous model treated investment as exogenous (I = constant). This ignores reality: business investment decisions are highly responsive to borrowing costs. We now make investment a function of two variables:
Y = C₀ + C₁(Y−T) + I(Y, i) + G
Where:
• I(Y, i) = Investment depends on both income Y and interest rate i
• Higher Y → Higher investment (firms invest more when demand is strong)
• Lower i → Higher investment (borrowing becomes cheaper, more projects become profitable)
Policy Implications
• Monetary stimulus = RBI lowers interest rates → increases investment → multiplier effect → higher GDP
• Fiscal stimulus = Government increases G → multiplier effect → higher GDP
Liquidity Preference Theory & Money Market
Money demand is the lynchpin connecting the goods market to monetary policy.
The Money Demand Function
M^d = $Y × L(i)
This states that aggregate money demand equals nominal GDP (price level P × real output Y) multiplied by a liquidity preference function L(i) that depends on the interest rate.
Why Do People Hold Money?
Income must be allocated across three uses:
• Consumption
• Money balances (zero yield)
• Financial assets—bonds, stocks, etc. (earn interest rate r)
The opportunity cost of holding money is the forgone interest rate. When interest rates are high, money becomes expensive to hold → people economize on cash and shift to interest-bearing assets. When rates are low, holding money is cheap → money demand rises.
The Money Demand Curve
• Downward sloping: Higher i → lower money demand
• Shifts with income: Higher Y → money demand curve shifts RIGHT (more transactions → more cash needed)
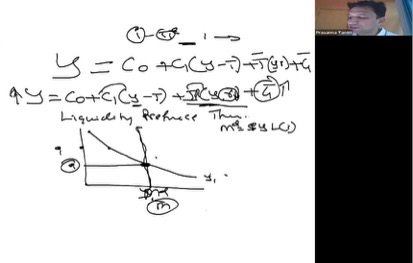
Key Equations and Liquidity Preference Theory Diagram
From Quantity Targeting to Interest Rate Targeting
The evolution of central banking practice reveals a fundamental shift in thinking:
| Old Approach: Quantity Targeting | New Approach: Interest Rate Targeting |
|---|---|
| Central banks fix money supply M | Central banks fix interest rate target (e.g., repo rate) |
| Interest rates fluctuate with money demand | Money supply adjusts to maintain target rate |
| Creates seasonal volatility and uncertainty | Provides stable expectations for borrowers |
Modern Monetary Policy: Interest Rate Targeting
The Reserve Bank of India, like most modern central banks, targets a specific real interest rate. This represents a fundamental change in policy implementation.
The RBI’s Operating Framework
• RBI sets a target for the Weighted Call Rate (WCR), the overnight interbank lending rate
• Maintains a corridor with a ceiling (marginal standing facility rate) and floor (reverse repo rate)
• When money demand increases → RBI supplies additional liquidity → maintains target rate
• When money demand decreases → RBI drains liquidity → maintains target rate
Caveat
The system assumes inflation expectations remain stable. If expected inflation rises → money demand increases → RBI must increase supply to offset. But if inflation expectations become unanchored (as in Venezuela), the central bank loses control.
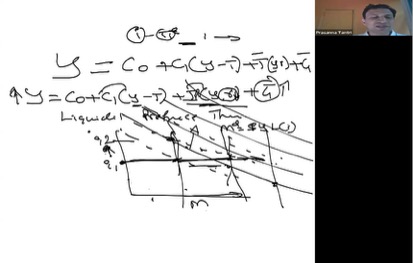
IS-LM Diagram with Interest Rate Dynamics
Real vs. Nominal Interest Rates
Real Interest Rate = Nominal Interest Rate − EXPECTED Future Inflation
(NOT current reported inflation)
Distinction Matters
• Borrowers and savers care about the REAL purchasing power they earn, not nominal returns
• Investment decisions depend on the real cost of borrowing
• Expected inflation is what matters, not historical inflation
The RBI’s Mistake
Many analysts in India calculate the real rate using current CPI inflation rather than expected future inflation. This led to a critical miscalculation: From 2022-2024, India experienced some of the highest real interest rates globally—seemingly tight policy. In reality, the RBI may have been accommodative because inflation expectations had fallen.
RBI Credibility & Inflation Expectations
The Self-Fulfilling Expectation Problem
Prices fall into two categories:
• Sticky prices: Fixed in advance through contracts (salaries, school fees, long-term service agreements)
• Flexible prices: Adjust frequently (food, fuel, daily commodities)
When people negotiate long-term contracts, they anticipate future inflation. If they believe the RBI will print money → they expect higher inflation → they demand higher wages and higher contract prices → this becomes self-fulfilling.
Real-World Evidence
In 2024, the US Federal Reserve cut rates by 100 basis points. Yet the 10-year Treasury yield remained at 4.2%. Why? Because markets don’t believe the inflation will fall as much as the Fed suggests. Central bank credibility is everything.
Money vs. Savings: A Critical Distinction
“Money is a representation of savings, not a replacement for savings.”
India’s Core Problem
Savings Rate Comparison:
• India: 27-28% of GDP
• China (during 8-10% growth era): 50-60% of GDP
Printing money does not create real savings. It merely changes prices. With inadequate savings, capital formation is constrained, limiting investment and growth. No policy manipulation can overcome a structural savings deficit.
The IS-MP Framework
The IS Curve
IS = Investment-Savings; represents the goods market equilibrium
Derived from:
Y = C₀ + C₁(Y−T) + I(Y, r) + G
• Shows all combinations of interest rate (r) and output (Y) where the goods market clears
• Downward sloping: r↑ → I↓ → Y↓ (via multiplier) → C↓
• Shifts with changes in C₀, T, and G
The MP (= Monetary Policy) Curve (Replaces LM)
Because the RBI fixes the interest rate target, monetary policy is represented as a horizontal line:
• The RBI announces a target repo rate
• The MP curve is a horizontal line at that rate
• For any level of output, the interest rate remains fixed
Equilibrium in the IS-MP Model
Short-term GDP is determined by the intersection of the IS curve and the MP curve.
So, “Who determines next quarter’s GDP? The RBI(at least in the short term)—because it controls interest rates.”
Long-run growth is determined by supply-side factors: productivity, innovation, capital accumulation, and institutional quality. The RBI can boost demand in the short term, but cannot increase long-run potential output.
Policy Applications
Tax Cuts and Stimulus Analysis
Q: Does a GST cut stimulate the economy?
A: “It depends” entirely on whether the RBI accommodates the fiscal expansion.
Case A: RBI Accommodates
• GST cut → C increases → IS curve shifts right
• RBI increases money supply to maintain target rate
• Output increases, stimulus works
• Risk: Inflation if money supply grows beyond real growth
Case B: RBI Does Not Accommodate
• GST cut → demand for money increases
• RBI does not increase money supply → interest rates rise
• Higher rates → crowding out of private investment
• No net stimulus effect
How to Determine Which Case Is Happening
Monitor the RBI’s Liquidity Adjustment Facility (LAF) operations and excess reserves in the banking system:
• If RBI is supplying excess liquidity → accommodating
• If RBI is draining liquidity → not accommodating
India’s Macroeconomic Constraints
The Fiscal Trilemma
India faces a structural constraint with government finances:
• Government debt: 84-85% of GDP
• GST revenue growth: 4% annually (below nominal GDP growth)
• Current budget structure requires 10% growth in revenue
This creates an impossible choice:
• Cut government expenditure significantly
• Increase fiscal deficits (unsustainable)
• There is no third option
Professor’s Policy Recommendations
To address India’s structural constraints:
• Strategic expenditure reduction: Cut government spending on non-productive sectors while protecting education and infrastructure
• FDI attraction: Increase foreign direct investment through policy certainty and regulatory clarity
• Innovation focus: Invest in R&D and technology to increase productivity
• Regulatory simplification: Remove barriers to business formation and operation
Takeaways
1. Investment depends on BOTH income and interest rates—this is the critical evolution from the Keynesian Cross to the IS-MP framework.
2. Modern central banks target interest rates, NOT money supply. Money supply becomes an endogenous tool to maintain the rate target.
3. Money supply is a tool, not a policy target itself. Printing money cannot solve real economic problems like low savings rates.
4. Real interest rate = Nominal rate − EXPECTED inflation. Calculating real rates using current inflation is a common analytical error.
5. Short-term GDP is effectively the RBI’s choice via interest rate targeting. Long-term growth requires supply-side improvements.
6. Money ≠ Savings. You cannot solve a savings problem by printing money. This is India’s fundamental constraint.
7. Inflation expectations are self-fulfilling. Central bank credibility is paramount to maintain stable expectations.
8. India’s declining savings rate (27-28% vs. China’s 50-60% in high-growth era) is a structural constraint that cannot be overcome through monetary policy alone.
Discussion Questions
How does the interest rate responsiveness of investment affect the effectiveness of monetary policy compared to fiscal policy?
Why might a central bank’s loss of credibility lead to an uncontrollable inflation spiral?
Given India’s savings constraint, what structural reforms could help increase capital formation?
How would you expect the IS-MP equilibrium to shift in response to a sudden increase in global interest rates?
Supplementary Notes/Revision (From My Handwritten Notes)
Concept of Aggregate Demand & Recession
1. Economists often predict recession. Recession is defined as output falling for 2 consecutive quarters. Why do economists think AD or output will fall in the near future?
2. The equilibrium condition is where AD = Output, or Z = Y (AD) = (output) GDP
3. The slope of Aggregate Demand is C1 (where C1 < 1) — it is also called the fiscal multiplier
4. This is where the IS curve comes into the picture, and there is an alternate way of understanding the same thing
5. Investment: I = Is + Īg (private investment + government/autonomous investment)
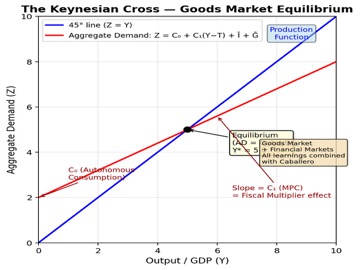
Keynesian Cross — Transition to IS Curve
Goods Market + Financial Markets Combined
1. All learnings from the goods market and financial markets are now combined, following Caballero’s framework
2. In the goods market, investment depends on the interest rate. This links the goods market to the financial/money market
3. This is the bridge to the IS-LM or IS-MP framework
The New Monetary Policy Paradigm
1. In the new paradigm, the interest rate is fixed and money supply is varied by RBI through VRR and VRRR operations
2. When money demand fluctuates, it can be stabilized by RBI conducting OMOs
3. Interest rate does not fluctuate immediately — only when inflation requires RBI to change the nominal rate explicitly
4. Earlier, central banks controlled money supply during festivals or advance tax payments. When money supply fluctuated, it moved interest rate violently, making long-term investment decisions by firms impossible in such an environment
5. The key driver of the Keynesian Cross is demand, and supply is thought to be constant because of price rigidity
6. The Keynesian view is good in the short-term because assumptions (price rigidity, production/labour efficiency/human capital constraints) are fairly accurate within that time-frame
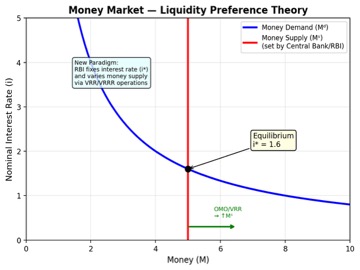
Money Market — The New Paradigm of Monetary Policy
What You Can Now Do
When a stimulus is announced, you no longer need an opinion — you need the bond market. If yields rise and the RBI sits still, you are in the no-accommodation case and the multiplier is being taxed away in real time; if the RBI leans in, the expansion is real and so is the inflation risk. Reread the fiscal trilemma before every budget season; it is the constraint the speeches never mention.
Continue to Session 5 — Fiscal Policy, Crowding Out & Transmission.